
Real estate & housing
What the homes are like, where prices and rents stand, and where to find live data, whether you're buying, renting, or just curious what the house down the street sold for.
The housing stock
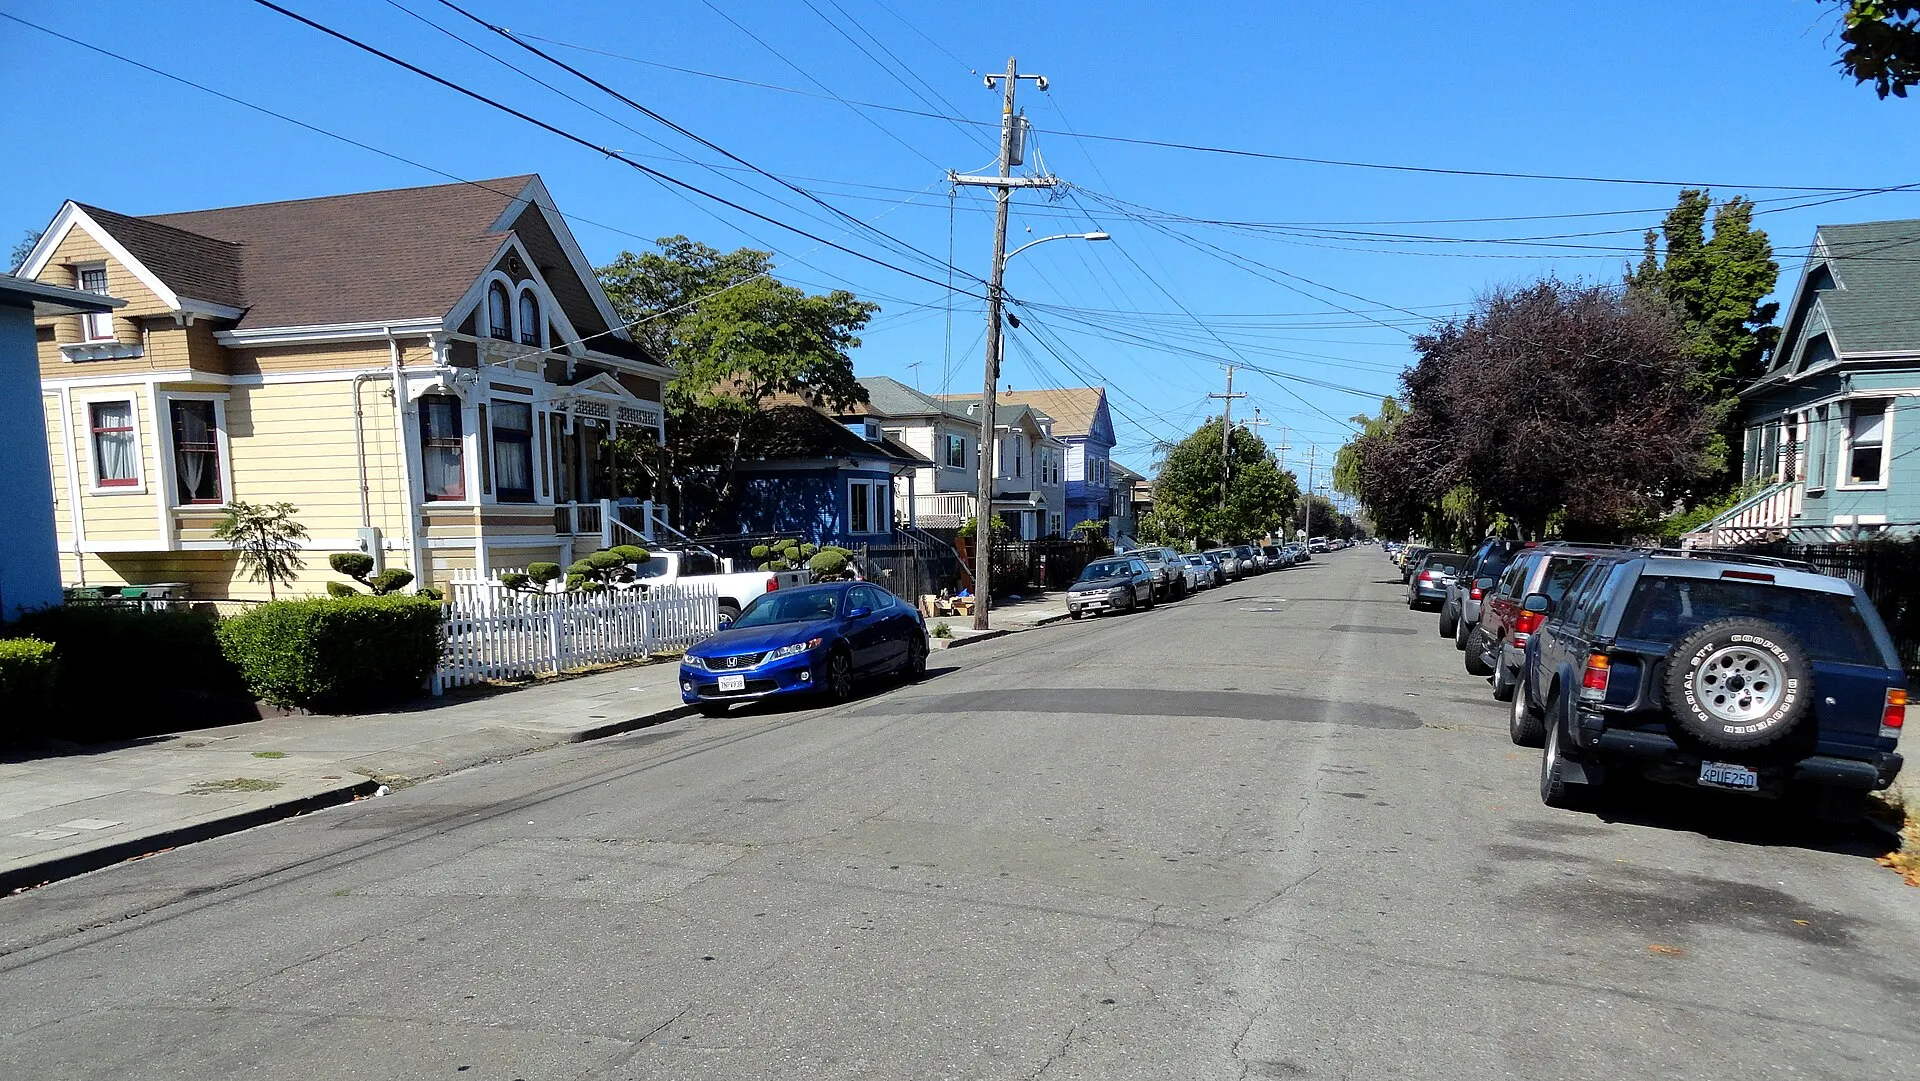
Most of Bushrod was built in the first decades of the 1900s, and the homes show it in the best way. Walk any block and you'll see a mix of:
- Edwardians with bay windows and tall ceilings, many from right after the 1906 earthquake
- Craftsman bungalows with deep front porches and built-ins
- Brown-shingle homes in the Bay Area tradition
- Occasional Tudor revivals and Victorian-era cottages
- Duplexes and small apartment buildings, mostly along the busier streets
.jpg)
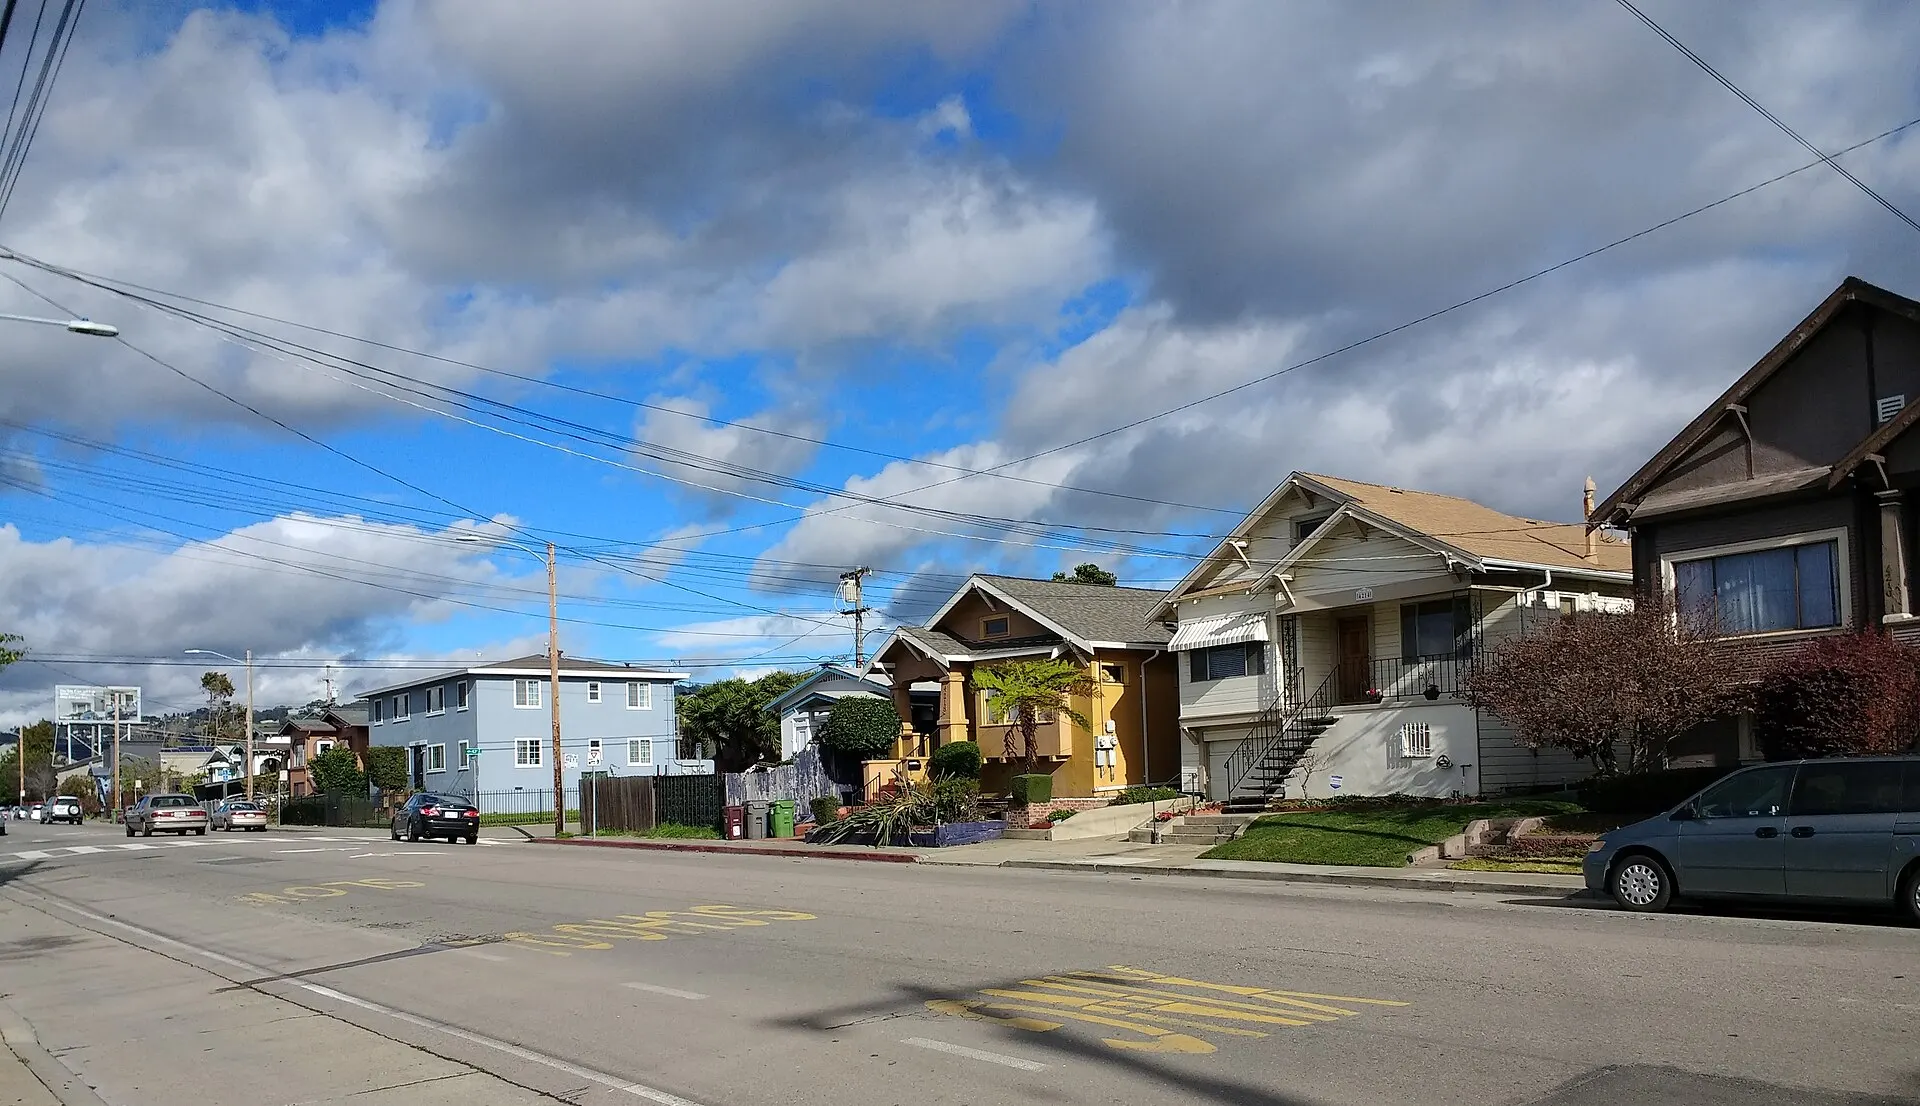

Lots tend to be modest, and many homes have been expanded with finished basements or backyard ADUs (accessory dwelling units).
Old-house tips
- Ask about the foundation and whether seismic retrofitting has been done. Look into the state's Earthquake Brace + Bolt grants.
- Check for original knob-and-tube wiring and galvanized plumbing.
- Get a sewer lateral inspection. EBMUD requires a compliance certificate when you sell or do a major remodel.
- Pull permit history from the city's Accela portal.
Market trends
Home values and rents, updated automatically each month as Zillow publishes new data. Hover over or tap a chart to see any month, or open the table view.
Fun fact: America's hottest neighborhood. In January 2017, Redfin named Bushrod the hottest neighborhood in the country for the year ahead, pointing to its restaurants and its easy access to BART. The prediction held up: Redfin's mid-year review found Bushrod home values rising far faster than the metro area's, with most homes selling well over asking. You can see that 2017 run-up in the chart below. Switch to "All data" to see the full story.
Typical home value
Zillow Home Value Index, all home types, mid-priced tier. Monthly.
- Bushrod
- Temescal
- Oakland
Show as a table
| Month | Bushrod | Temescal | Oakland |
|---|---|---|---|
| August 2026 | $1,017,349 | $1,064,252 | $708,610 |
| August 2025 | $987,105 | $1,013,360 | $714,811 |
| August 2024 | $1,147,460 | $1,174,513 | $797,150 |
| August 2023 | $1,170,984 | $1,237,151 | $826,140 |
| August 2022 | $1,297,188 | $1,357,845 | $906,094 |
| August 2021 | $1,269,540 | $1,311,803 | $887,906 |
| August 2020 | $1,115,686 | $1,187,162 | $773,586 |
| August 2019 | $1,085,118 | $1,191,628 | $755,738 |
| August 2018 | $1,096,049 | $1,198,092 | $756,328 |
| August 2017 | $991,407 | $1,092,254 | $685,800 |
| August 2016 | $903,191 | $1,018,854 | $631,353 |
| August 2015 | $794,625 | $895,336 | $545,140 |
| August 2014 | $650,062 | $731,695 | $458,697 |
| August 2013 | $567,290 | $620,300 | $391,218 |
| August 2012 | $445,318 | $499,968 | $296,111 |
| August 2011 | $475,617 | $505,875 | $304,267 |
| August 2010 | $512,796 | $550,829 | $343,476 |
| August 2009 | $490,994 | $505,971 | $342,615 |
| August 2008 | $542,866 | $557,470 | $433,419 |
| August 2007 | $619,700 | $601,488 | $510,681 |
| August 2006 | $636,577 | $611,482 | $528,942 |
| August 2005 | $619,416 | $605,985 | $500,826 |
| August 2004 | $499,602 | $502,603 | $416,310 |
| August 2003 | $442,029 | $420,371 | $359,626 |
| August 2002 | $398,203 | $393,645 | $326,186 |
| August 2001 | $360,912 | $370,254 | $292,738 |
| August 2000 | $293,030 | $298,544 | $234,310 |
Typical asking rent
Zillow Observed Rent Index, all rental types. Zillow doesn't publish rents for individual neighborhoods, so ZIP 94609 stands in for Bushrod.
- ZIP 94609
- Oakland
Show as a table
| Month | ZIP 94609 | Oakland |
|---|---|---|
| August 2026 | $2,778/mo | $2,735/mo |
| August 2025 | $2,520/mo | $2,484/mo |
| August 2024 | $2,431/mo | $2,405/mo |
| August 2023 | $2,546/mo | $2,467/mo |
| August 2022 | $2,558/mo | $2,530/mo |
| August 2021 | $2,474/mo | $2,436/mo |
| August 2020 | $2,592/mo | $2,467/mo |
| August 2019 | $2,521/mo | $2,515/mo |
| August 2018 | — | $2,401/mo |
| August 2017 | — | $2,340/mo |
| August 2016 | — | $2,202/mo |
| August 2015 | — | $2,000/mo |
Data through August 2026 from Zillow Research (ZHVI & ZORI). Updated automatically each week.
Reading these numbers: Zillow's index estimates the value of a typical mid-priced home, not the price of homes that happened to sell. A small neighborhood only has a handful of sales each month, so sale-price medians swing a lot. For a real sense of value, look at recent comparable sales on your own block.
Renting in Bushrod
Renters in older Oakland buildings may be covered by rent control and just-cause eviction protections. The city's Rent Adjustment Program (510-238-3721) can tell you what applies to your unit.
What drives prices here
- Location: easy access to Berkeley, Temescal, BART, and Highway 24 for commuters.
- Character homes: buyers pay a premium for well-kept original details.
- The park: homes on the blocks right around Bushrod Park are especially sought after.
- Flat, walkable streets that make getting around by bike or on foot easy.
- Interest rates and Bay Area jobs: the same regional forces that move the whole East Bay market.
North Oakland has also changed a lot over the past few decades. Rising prices have displaced many longtime, especially Black, residents. It's worth knowing that history and supporting neighbors who want to stay. See our neighborhood history.
Live data & resources
Redfin: Bushrod market
Median sale price, days on market, and recent sales.
redfin.comZillow: Bushrod home values
The Zillow Home Value Index and its trend over time.
zillow.comRedfin: ZIP 94609
A bigger sample than the neighborhood page, so the trends are steadier.
redfin.comOakland rent trends
Citywide rent data from Zillow.
zillow.comAlameda County property info
Look up assessed value, taxes, and parcel details for any address.
acgov.orgCounty Assessor
Homeowner's exemption, Prop 19 transfers, and the parcel viewer.
acassessor.orgRent Adjustment Program
Oakland's rent control, tenant protections, and landlord obligations.
oaklandca.govThis page is general information, not financial or legal advice.